November 19, 2024
James Stevens
Over the past year, I’ve repeatedly encountered articles and individuals expressing concern about buying Nvidia stock at its current price. Much of the concern seems to stem simply from the fact that the price of NVDA has risen so rapidly over the past year. Today, it closed at $147.01, near its all-time high, and about 190% higher than its price one year ago. The phrase “AI bubble” has been thrown around quite a bit in the context of Nvidia’s stock price. However, this growth alone does not necessarily mean the stock is overpriced. Compared to earnings, it’s about as “cheap” as it has consistently been over the past several years. In fact, there is potential risk in not investing in Nvidia that I haven’t seen anybody focusing on.
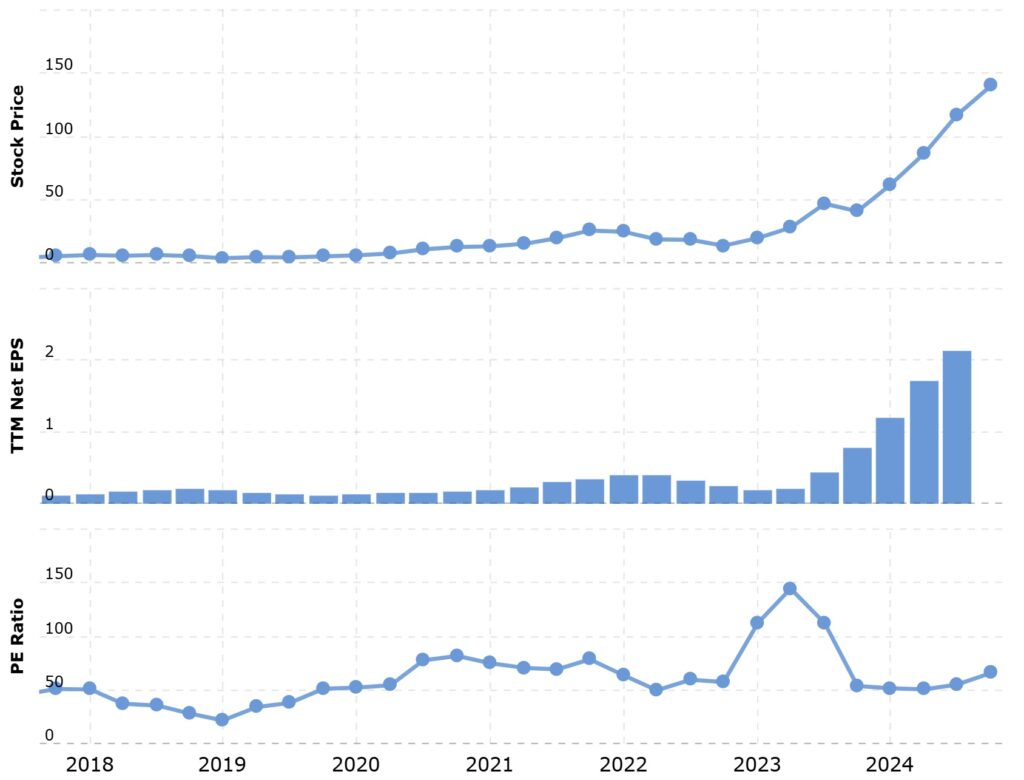
Here’s a chart showing Nvidia’s stock price, trailing 12-month EPS (earnings per share), and trailing P/E ratio (price-to-earnings ratio) over the past 7 years.

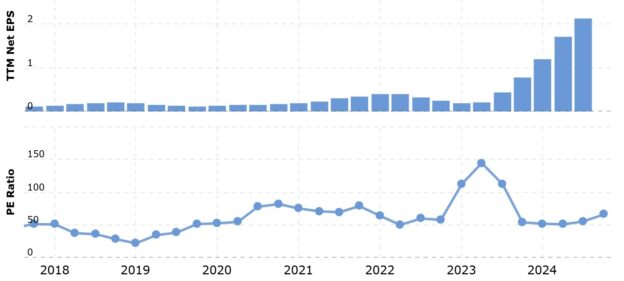
You can see that the trailing P/E ratio has remained relatively consistent over the past 5 years (aside from a brief spike in early 2023, which turned out to be investors correctly predicting forthcoming massive growth). The stock price has grown rapidly because earnings have grown rapidly, and the growth in stock price has remained roughly proportional to the earnings growth. So, if you think Nvidia is overpriced right now, then you should have also considered it overpriced in November of 2017, and if you’d avoided investing in it at that time, you would have missed out on its subsequent 2600% gain.
Moreover, Nvidia’s current forward P/E of 35.71 is not much higher than that of other stocks that you probably consider quite stable and reliable. Walmart’s is 30.86. Apple’s is 30.67. Procter & Gamble’s is 24.51. But, you might ask, does Nvidia’s assume unbelievably fast growth over the next year? Well, if you were to instead calculate a forward P/E without any assumed growth by annualizing their earnings from last quarter (Q2 2024 earnings of $16.6B x 4 would be $66.4B), you’d get a “forward” P/E of 55. Considering that Nvidia’s Q2 net income was 2.7 times its Q2 net income one year ago, its P/E ratio seems quite reasonable to me, no matter how you look at it.
Over many years, Nvidia has developed, and continually improved, an unmatched, powerful computing platform and associated software stack. They have about 90% of the GPU market share, and that share has been increasing. Businesses have recognized the value of generative AI and how essential Nvidia’s chips are to powering the machine learning algorithms involved; as a result, Nvidia’s Blackwell superchips are sold out for the next 12 months. Skeptics keep asking, what happens if generative AI doesn’t turn out to be as valuable as businesses hope? Yet the trend we see is that these AI tools have been continually improving. So my question for the skeptics is: what happens if generative AI continues to increase in value?
There is risk in investing in any company. Right now, Nvidia doesn’t seem like a highly risky investment to me.
In fact, I see risk in not investing in Nvidia. Generative AI is already making many workers more productive and decreasing the differences between better workers and less productive ones. To create their AI models, tech companies are hoovering up data, possibly your data. If you’ve ever posted anything on the internet, it may very well be used to train an AI tool to perform a task that you’re good at, and you likely won’t be compensated. As a simple example, an AI model can use text you’ve created to learn how to write, answer questions, and carry on a conversation. The one job that you’d think would be reliable during an AI-driven industrial revolution, software development, is already being augmented by AI coding assistants.
Exactly how generative AI will affect worker productivity, salaries, and unemployment is highly uncertain. Right now, many C-suite executives think generative AI will shrink workforces. Others are quick to remind us that, in the past, many new innovations have created more jobs than they destroyed. Yet, even if this happens, generative AI advancements will lead to disruption in the job market and changes to the skills required to remain a valuable worker. And as for hypothetical job creation, the invention of the automobile may have created more new jobs than it destroyed, but in this analogy are we actually the human workers? Because it also led to a lot of unemployed horses.
We cannot predict the future, but in any scenario, tech companies will be using your own marketable expertise to train models to do what you do. Without laws ensuring that you’re compensated, the only way for you to get a cut from the businesses that will create uncertainty and instability in your employment may be to become a partial owner of said companies, i.e., to invest. If 10 years from now, you’re desperately trying to re-train in the midst of a surprisingly challenging job search, you may wish you had invested in the businesses powering the disruption. At the very least, you could consider it a hedge against one possible outcome.
While it may not yet be clear which software companies will dominate the AI space, it has been evident for a long time that one hardware company will power the revolution for the foreseeable future: Nvidia.
Disclosure: I am long NVDA, obviously. I say “obviously,” not because only someone with NVDA shares could write such a supportive article, but because any person with a GPU programming background and money to invest would consider Nvidia a promising investment.
Disclaimer: Investing involves risk. Do your own research. Before making any investment decisions, seek advice from a registered investment advisor, which I am not. By accessing this site, you acknowledge that the author holds no liability for any profits or losses you incur.


